In 2015, my students and I founded an annual math fair in my school division. Inspired by mathematical play, the fair grew from humble beginnings into a staple of my mathematical calendar. Like nearly everything about this school year, the fair was jeopardized by the pandemic; however, with a touch of innovation and the ongoing support from my school administration, the teams of educators in our five feeder elementary schools, our trustee, and the school community council, I managed to pull together three math invitation carts that could be disassembled, transported, and reassembled in the elementary schools.
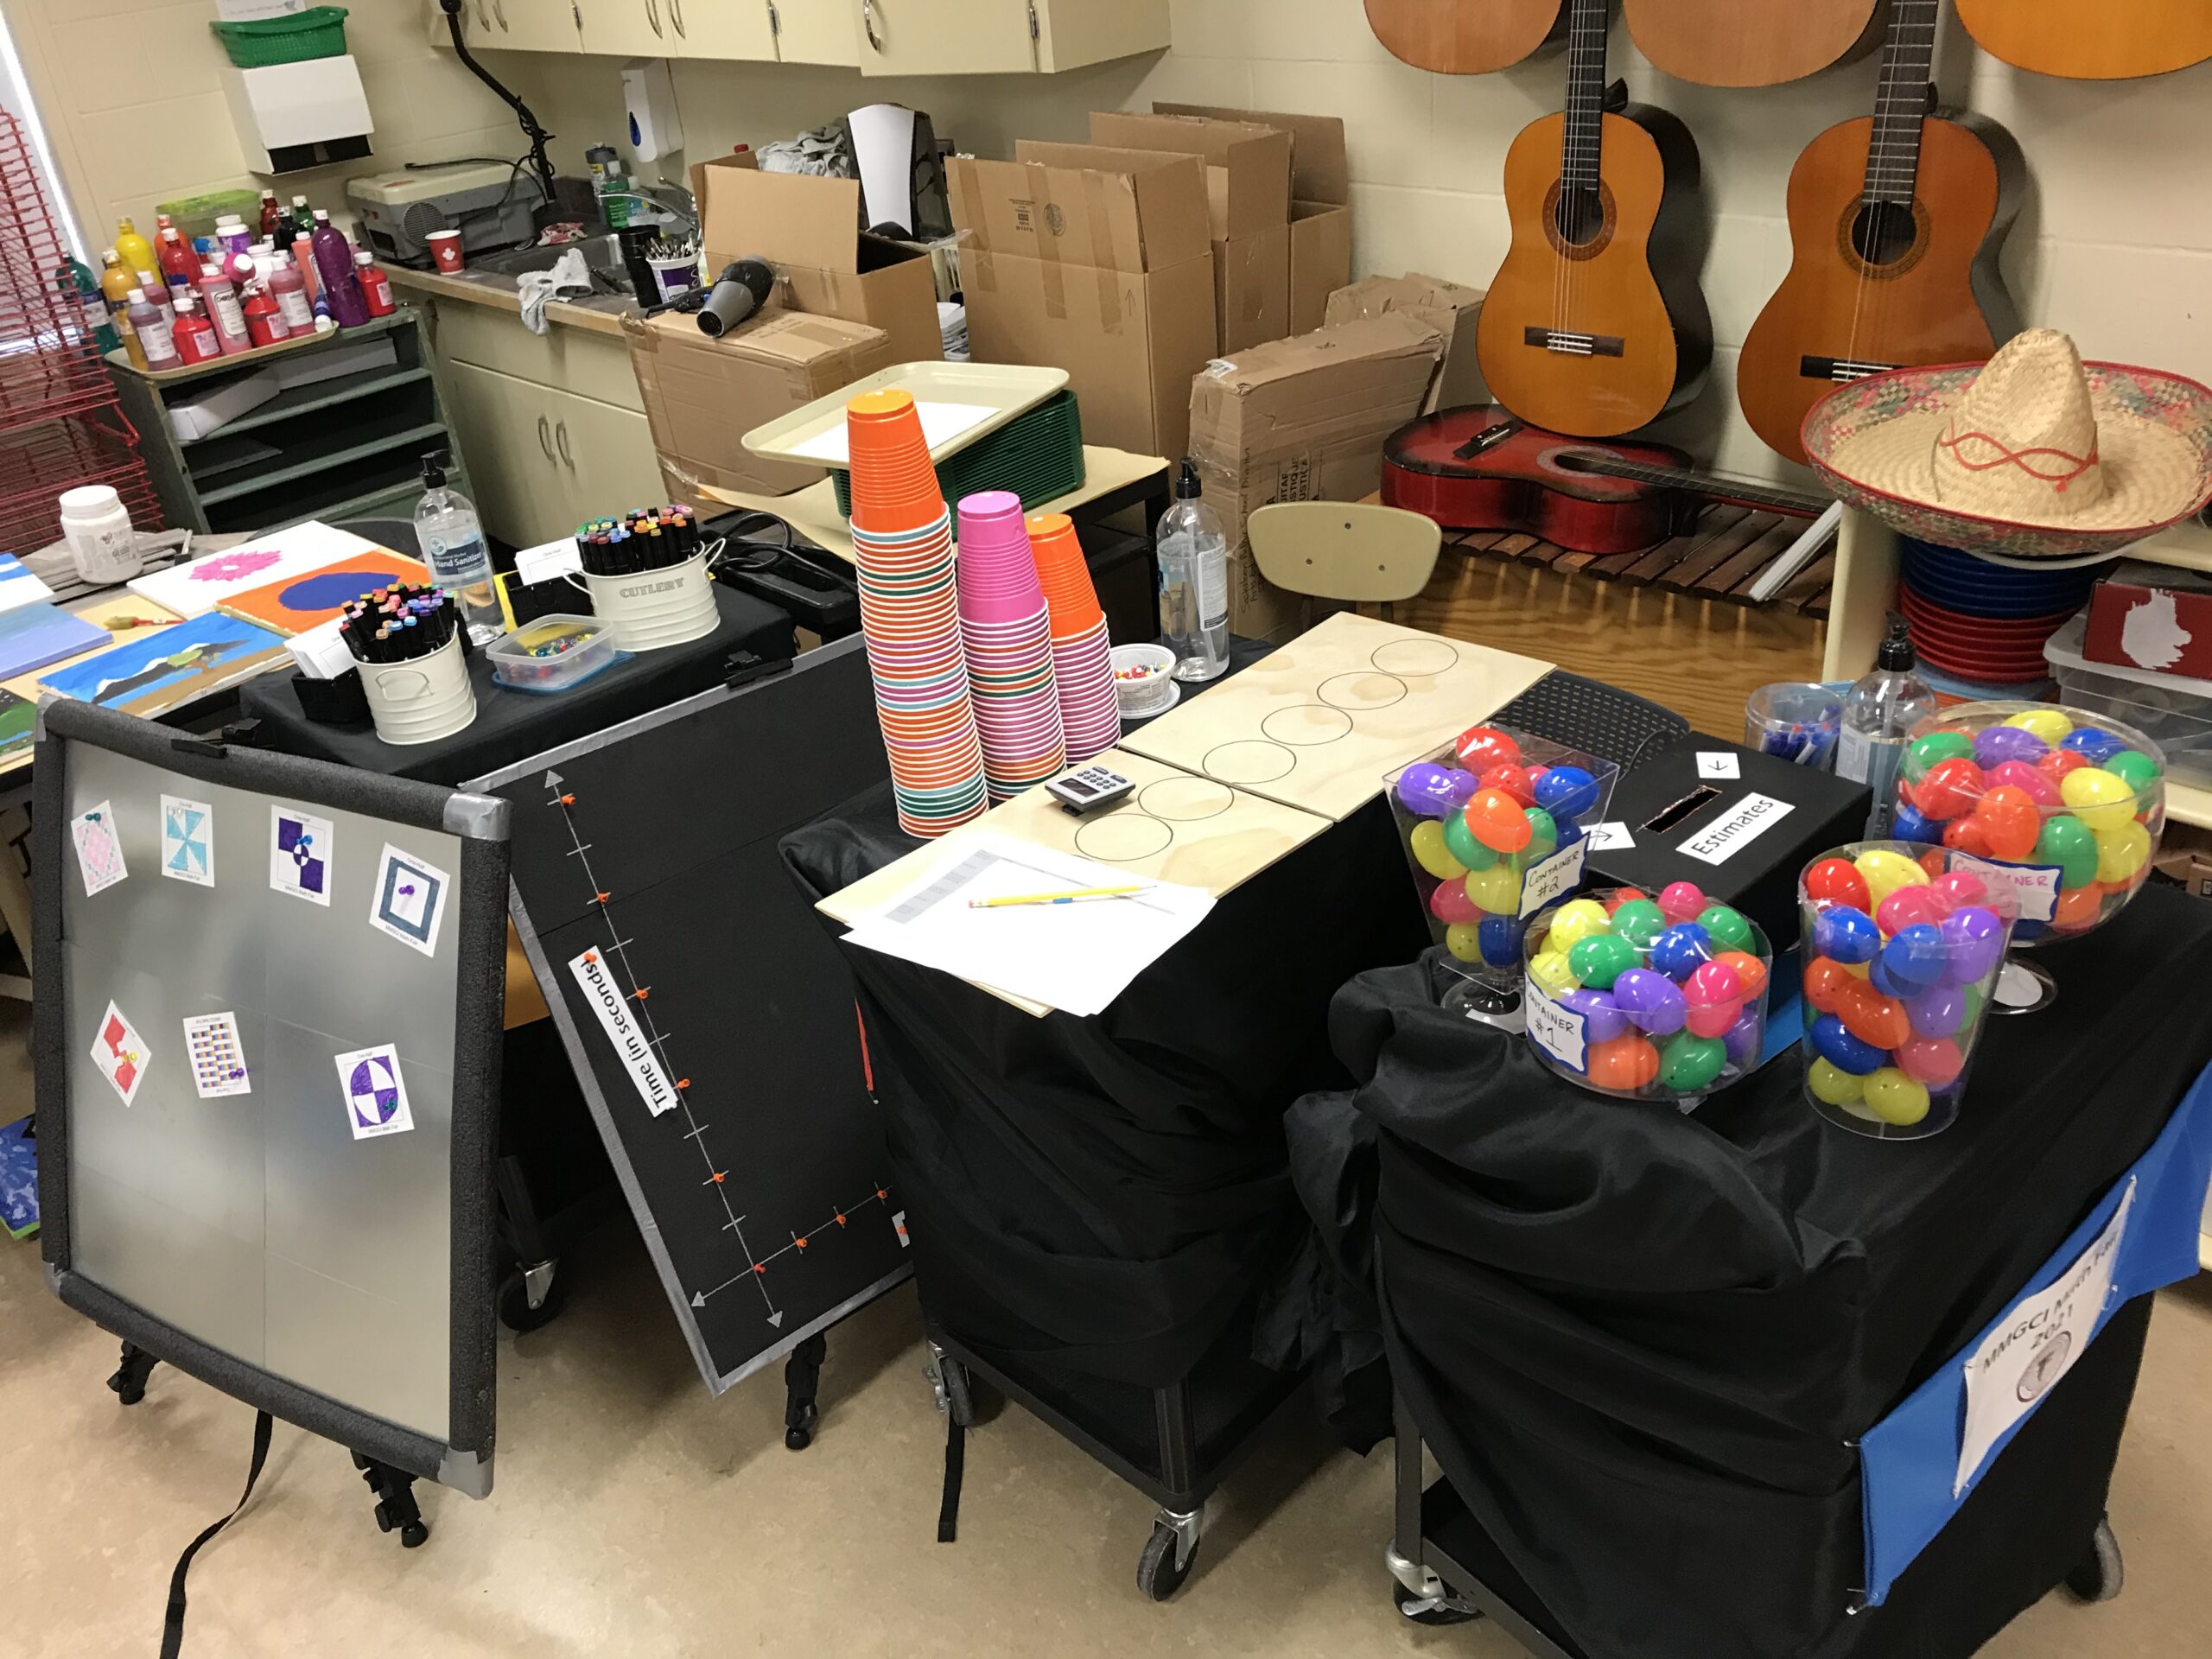
The travelling carts assembled in the back room of an elementary school
Over the course of a couple months, colleagues and I packed up the carts and delivered them to five excited elementary schools. Although it was really hard to not be allowed to math alongside the youngsters and their teachers (due to COVID protocols), the stories from the elementary school communities served as evidence that the fair sponsored mathematical joy and connectedness in this strange school year.
Below is a brief description of the three carts. The three were delivered as a set and lived in each elementary school for about six school days. Some schools opted to set up the fair in a central place and have classes come play one at a time. Other schools opted to roll the invitations from classroom to classroom. As with all things, adversity often leaves behind an opportunity, and I think a travelling math fair cart might be a nice idea to incorporate into the annual event moving forward.
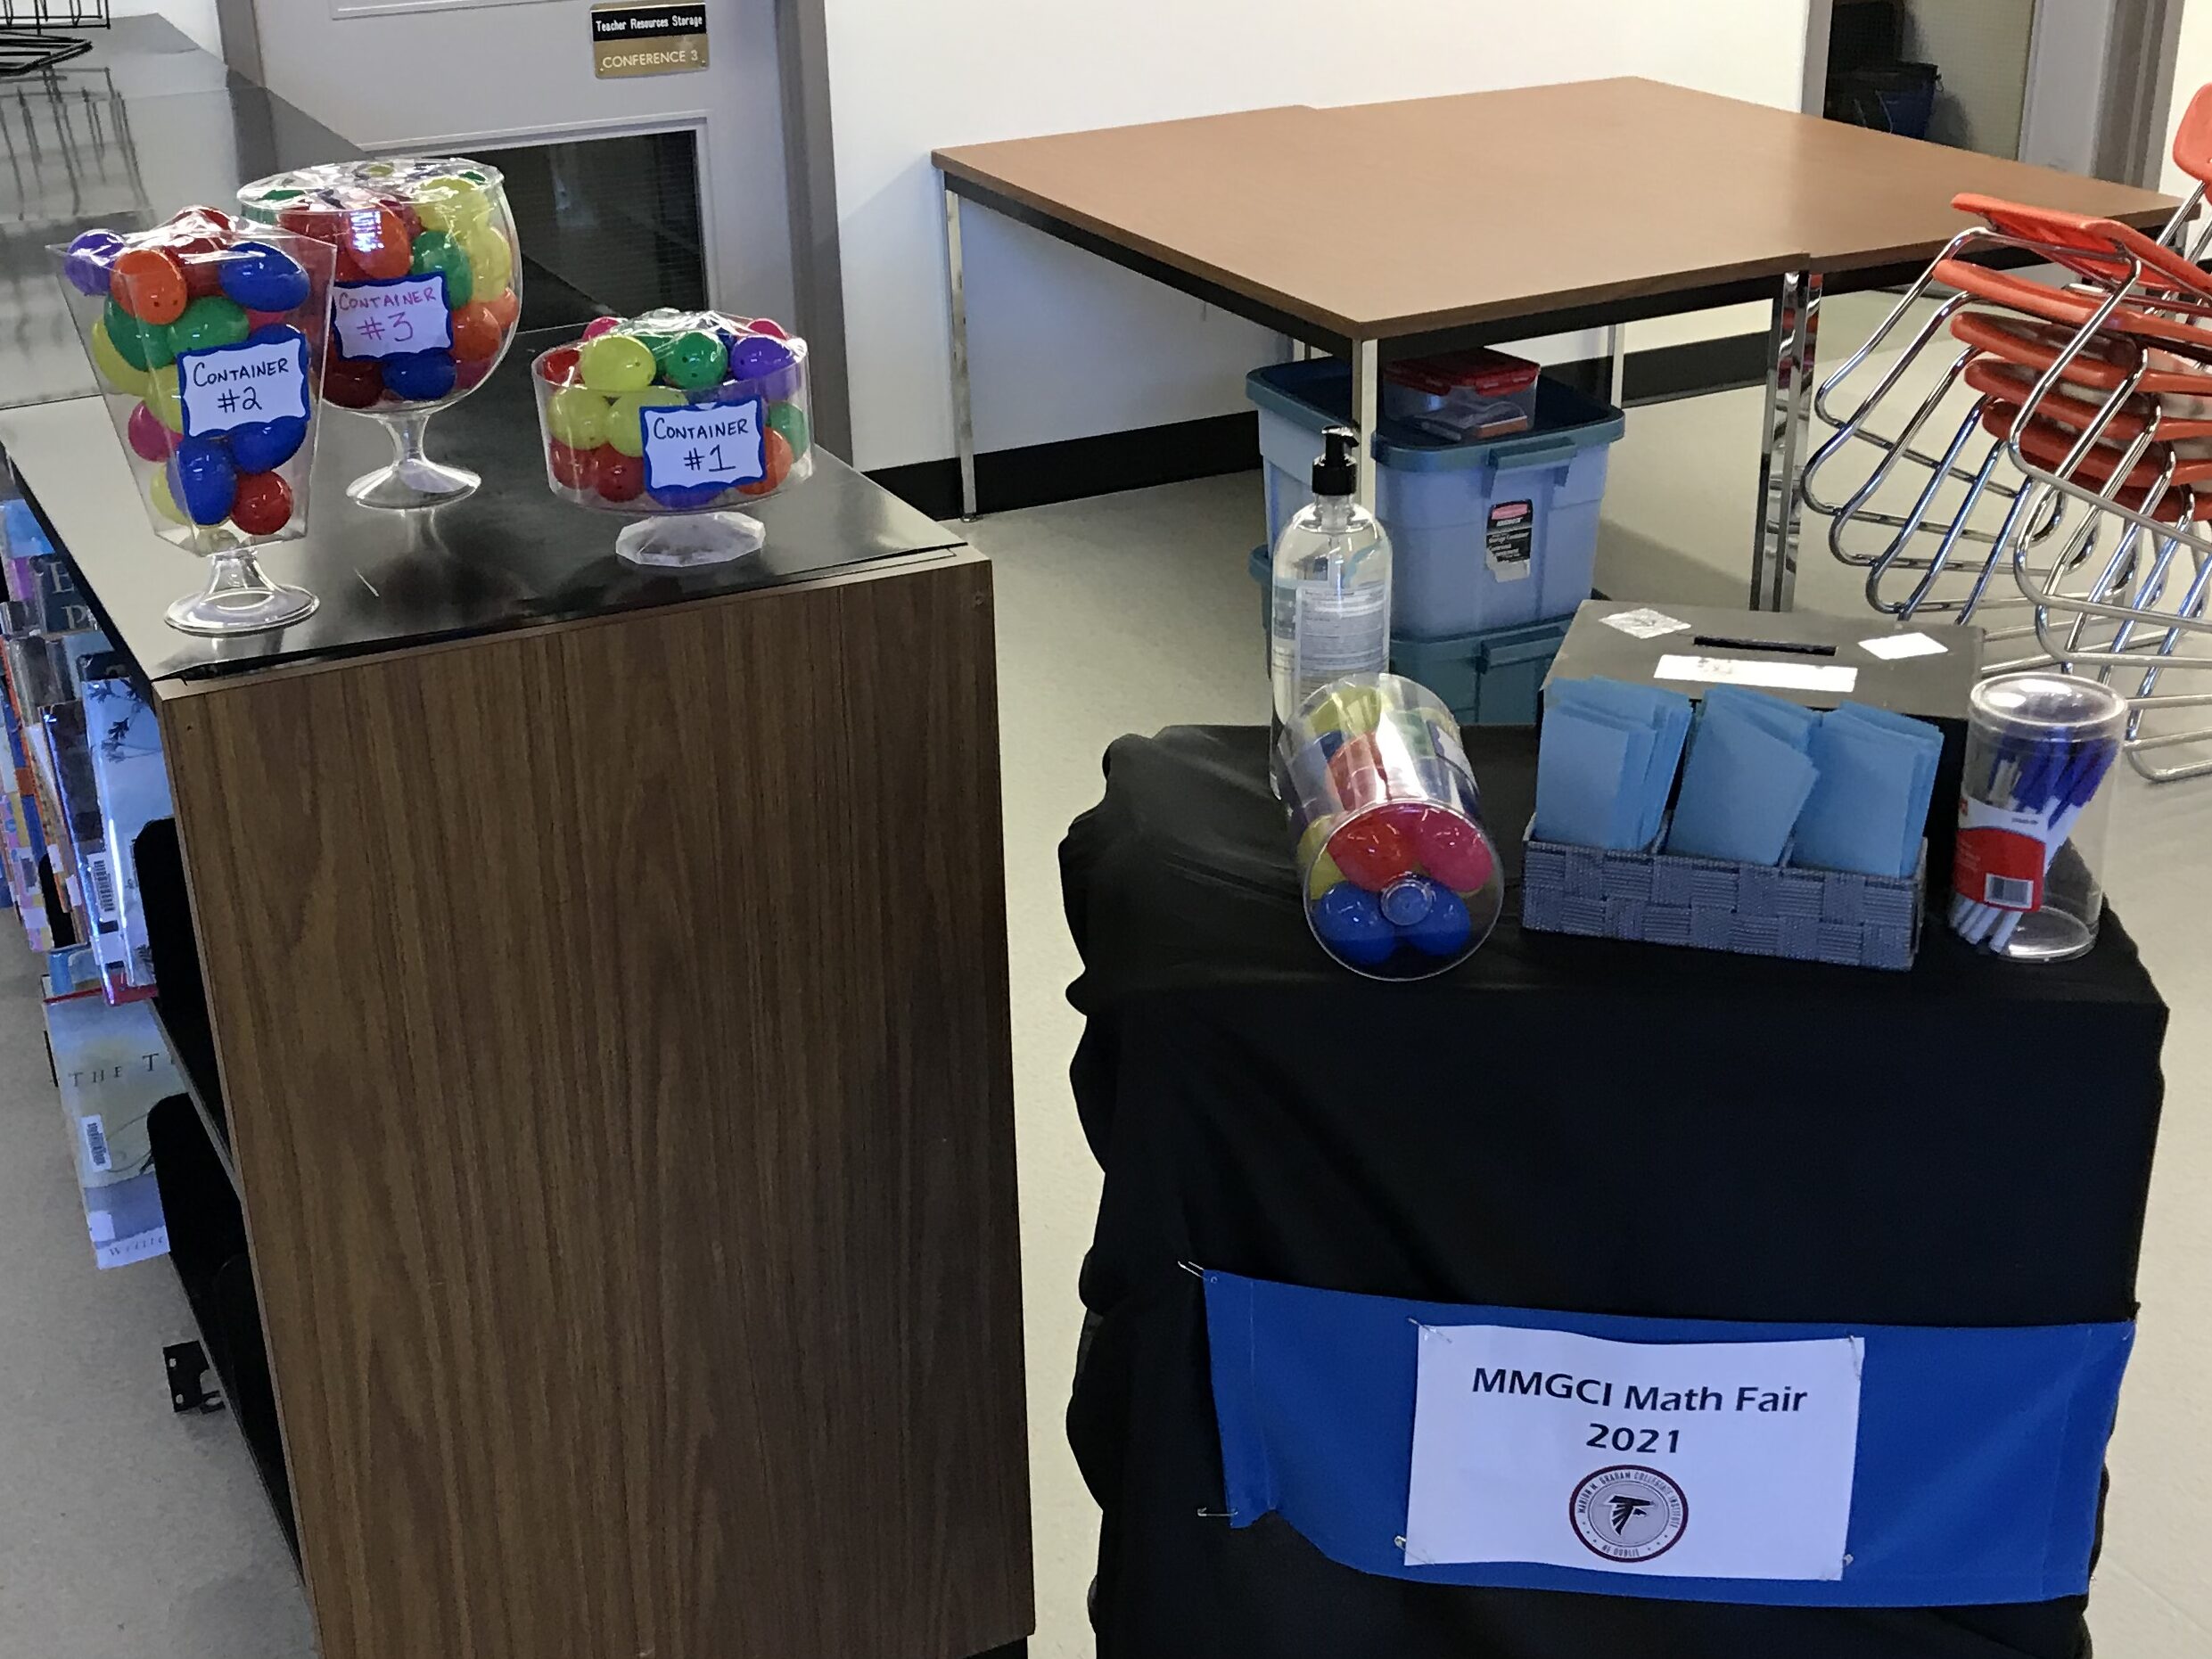
Estimation Station
This is a very standard idea designed to engage learners across a variety of grade levels. Four containers are filled with hollow plastic eggs (chosen for their light weight and low price point). The amount of eggs in one container is given, and students are asked to estimate how many eggs are packed into the other three. Key here is highlighting the similarities and differences between the containers. What about their shape and/or influences your estimation? Has someone else convinced you to update your estimations? Estimations are collected on paper ballots and placed all together in the black shoe box.
The Estimation Station set up in the library of an elementary school
One-Half Station
Inspired by Carla Dawson’s work with “Ten Days of Halves,” this station invites students to shade exactly one-half of a square as creatively as possible. Students are supplied with a template that consists of two large squares each sectioned into a 12×12 grid of smaller squares. With some inspiration provided from previous students, they set out to colour exactly one half of the square, duplicate it on the second half, tear the two apart, magnet one “half” to the display, and take the other “half” home.
Teachers encouraged students to half with a variety of diagonal lines and symmetries. They were also instructed to give students as many cards as they wanted as inspiration struck.
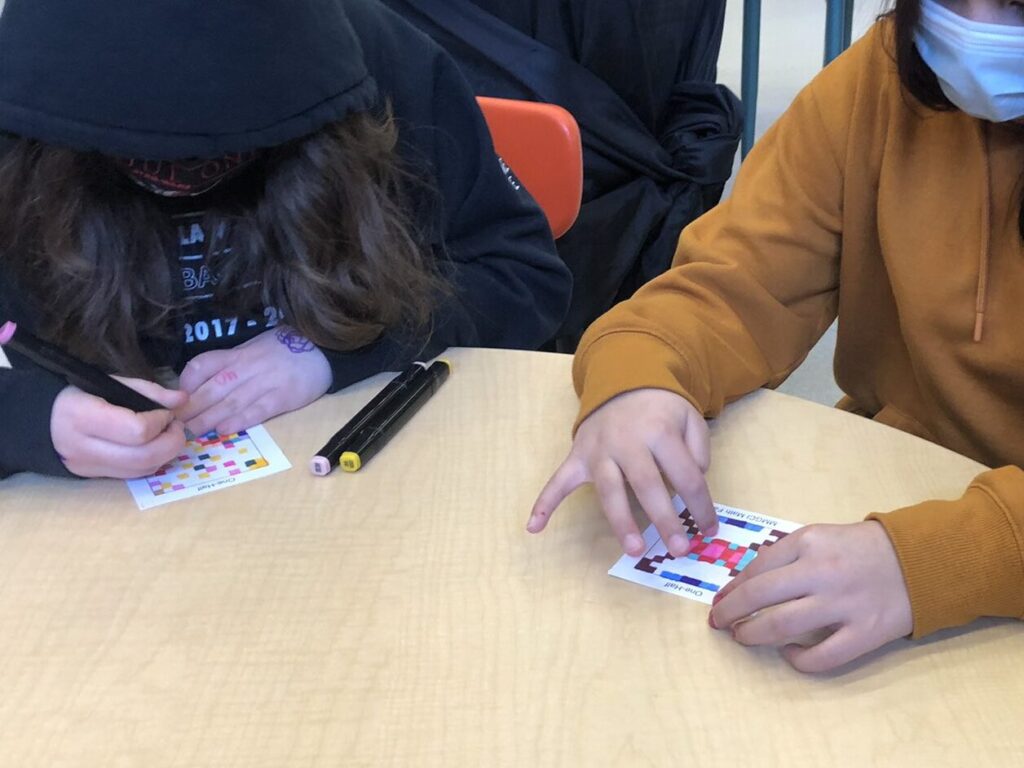
Students shading exactly one half 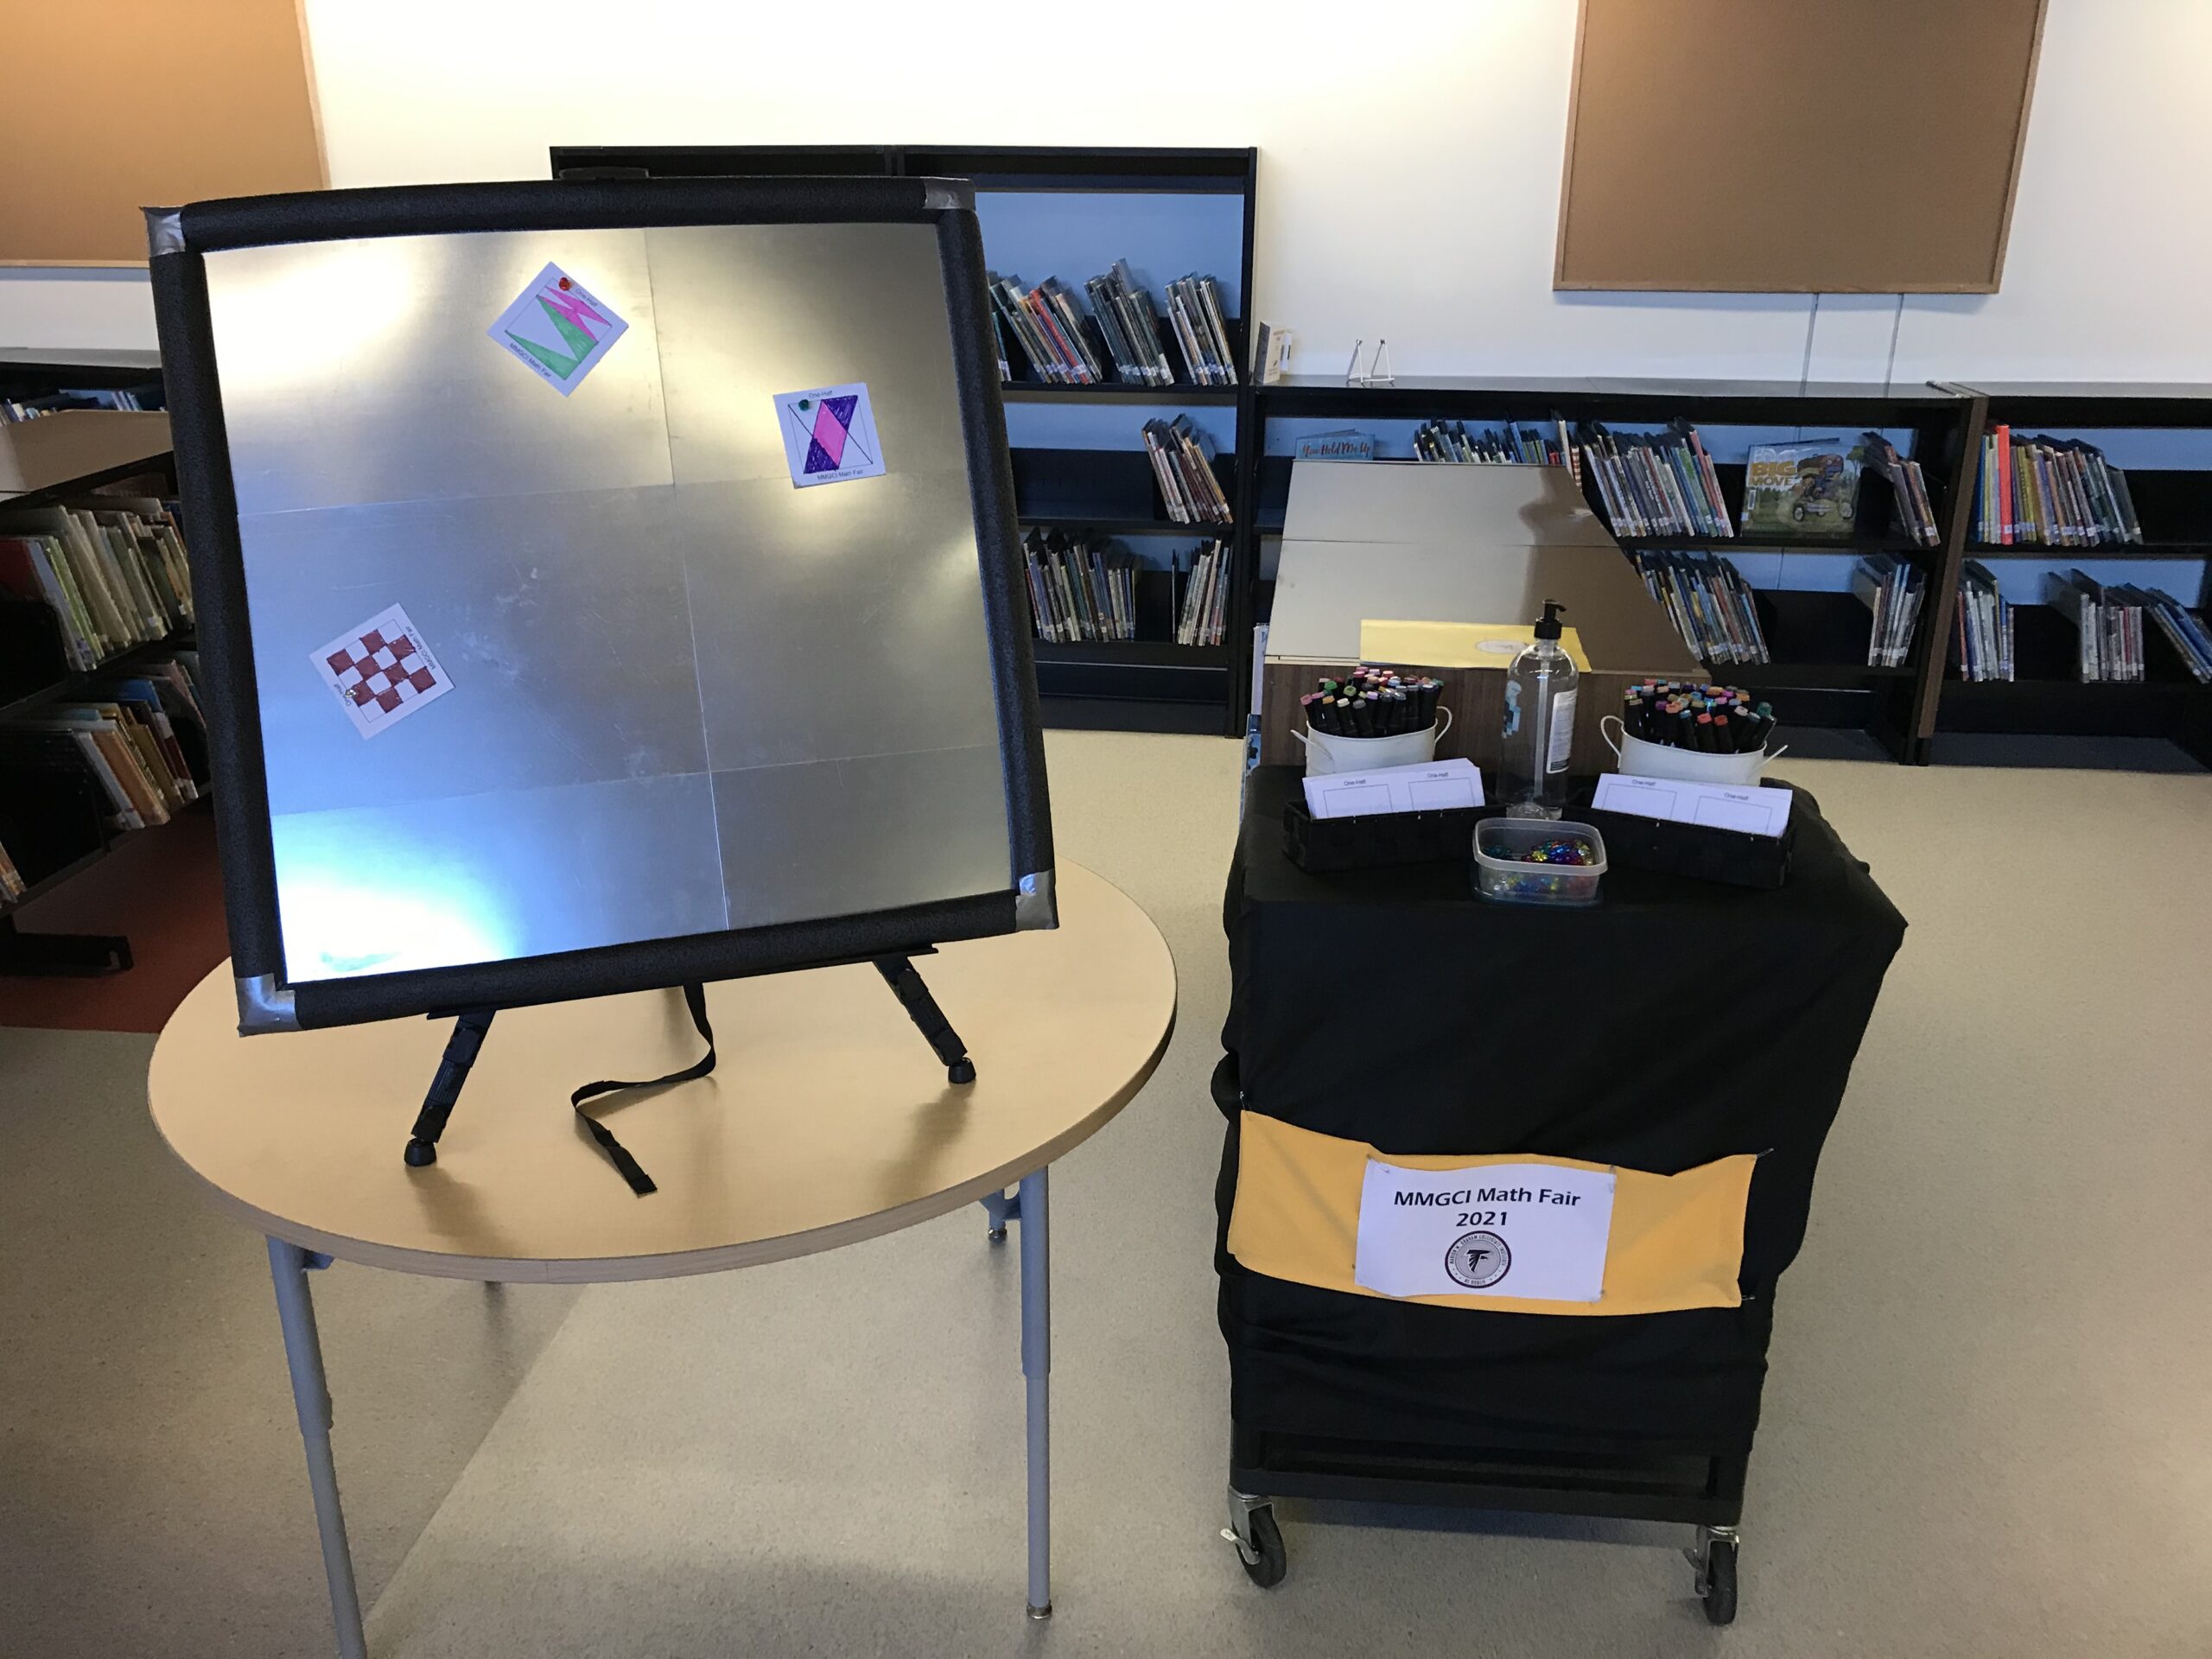
The One Half Station set up in an elementary school 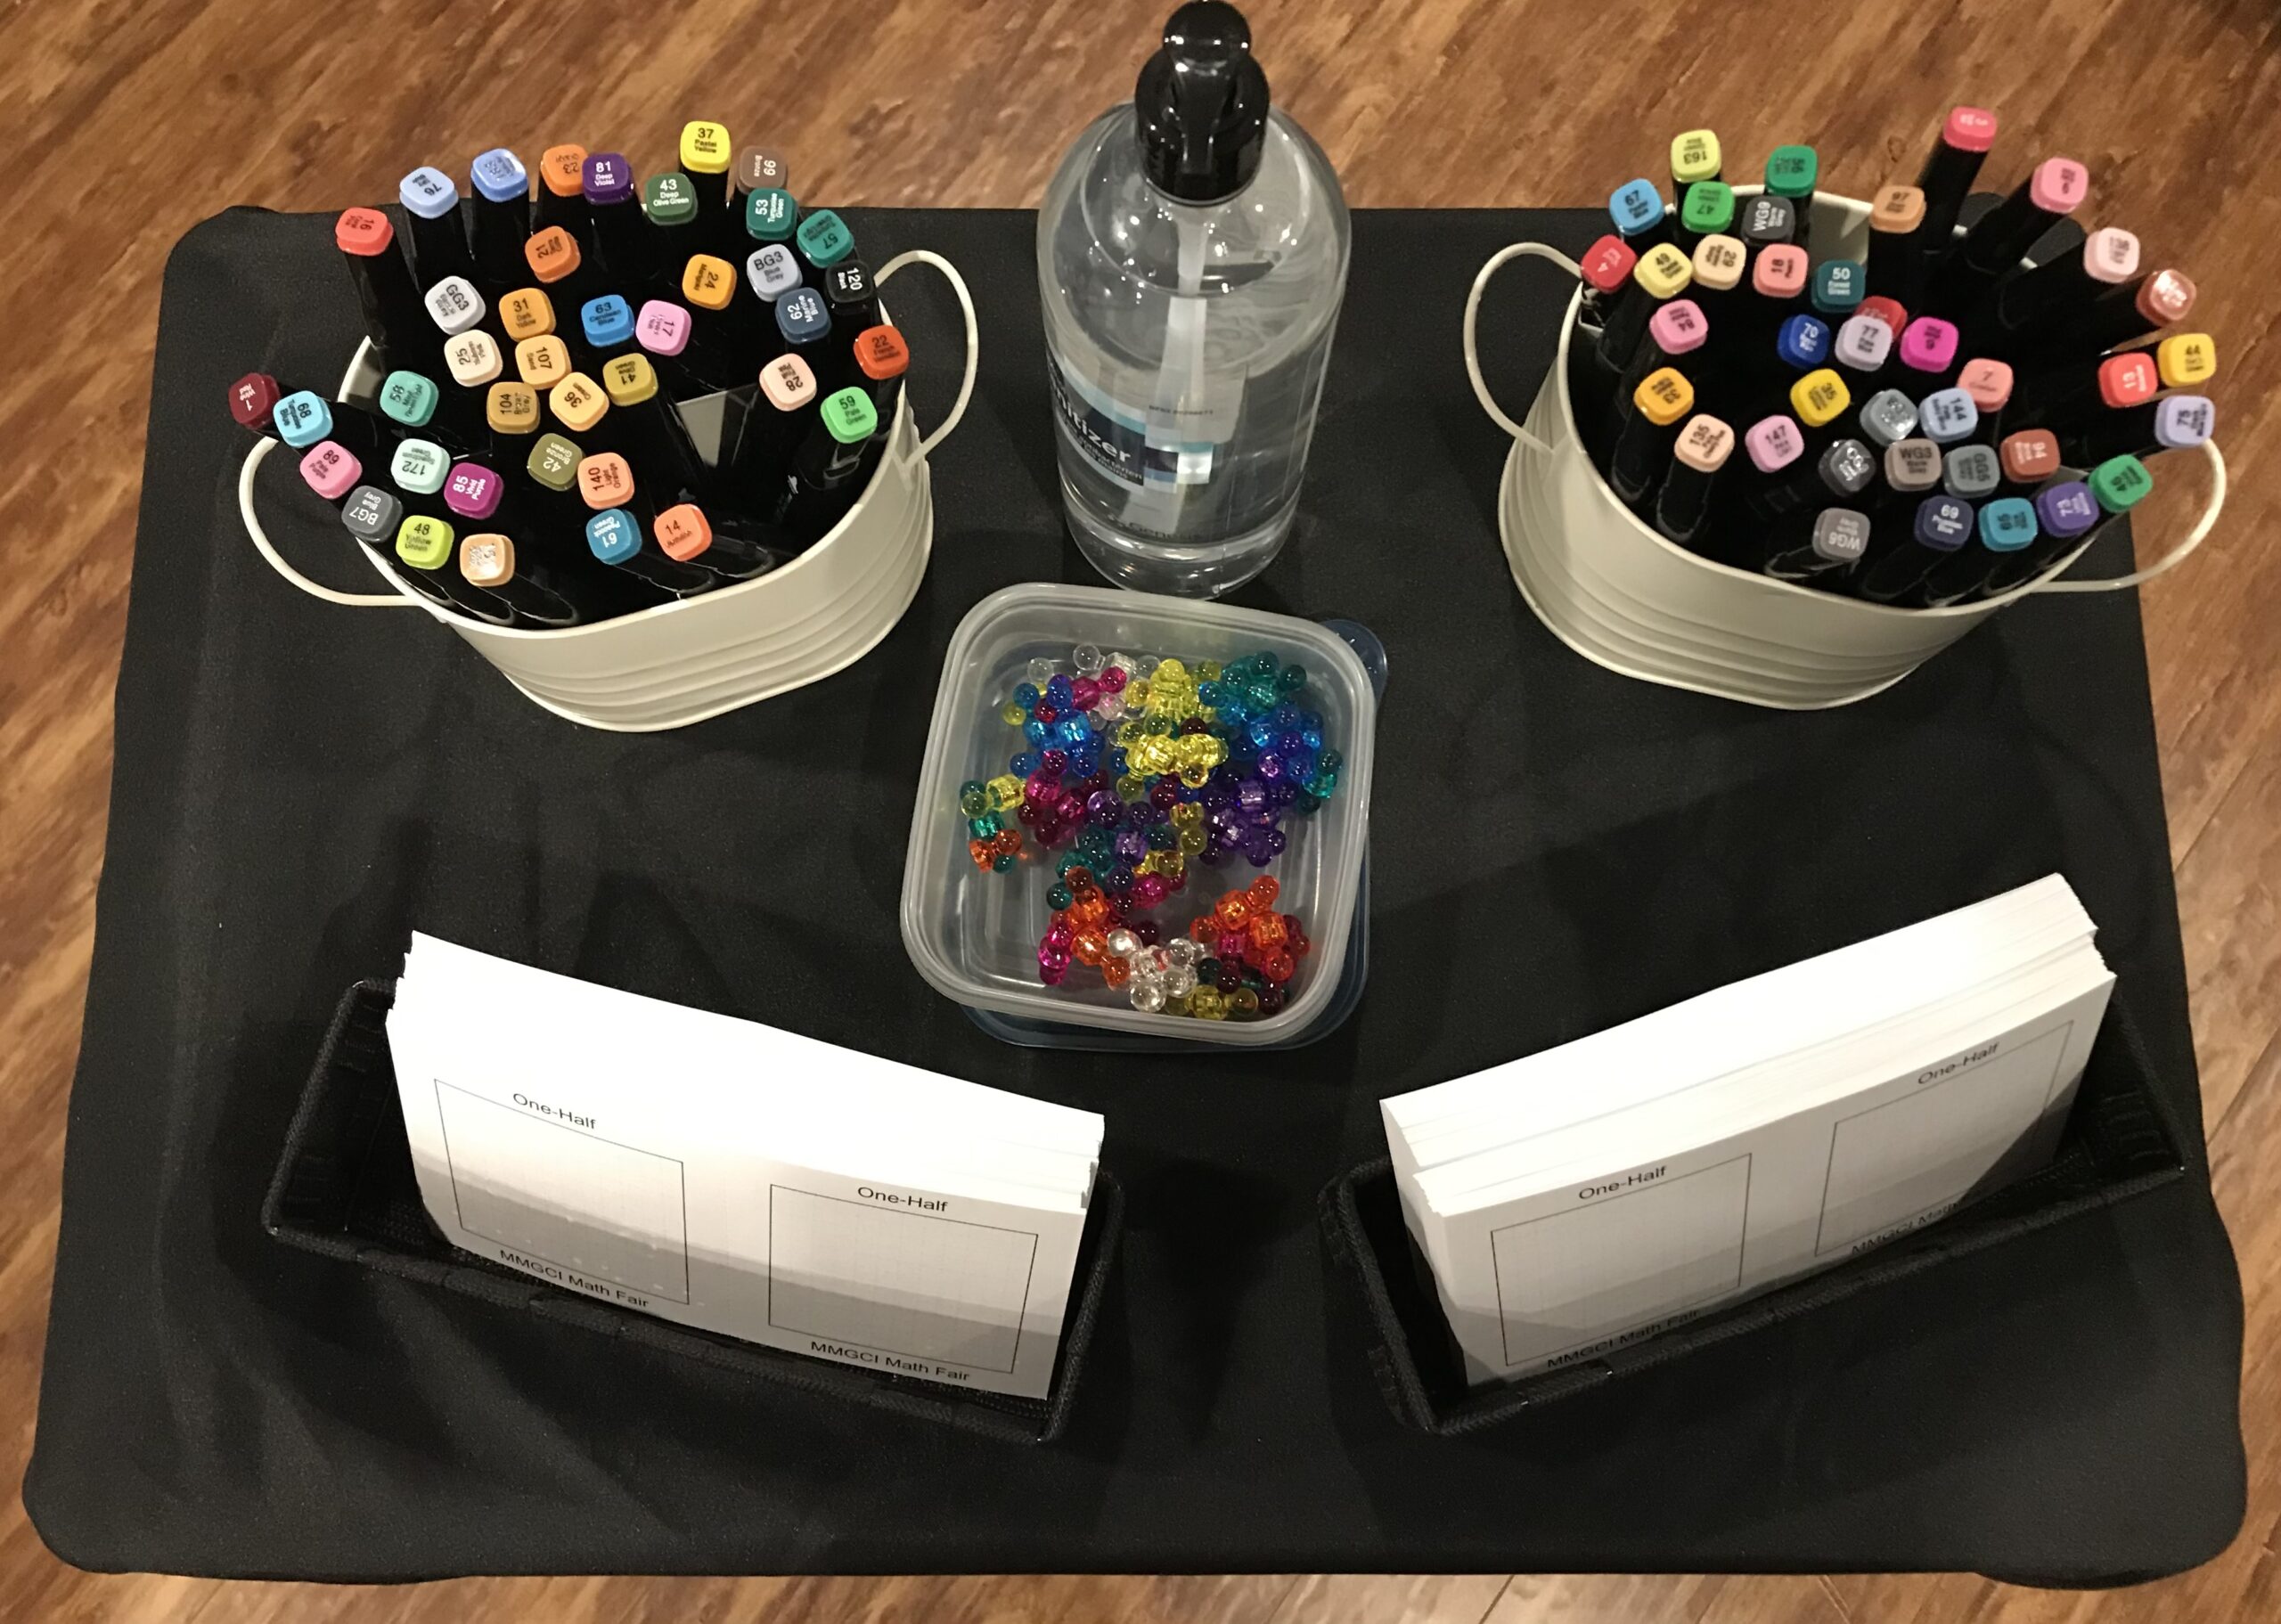
The One Half Station set up
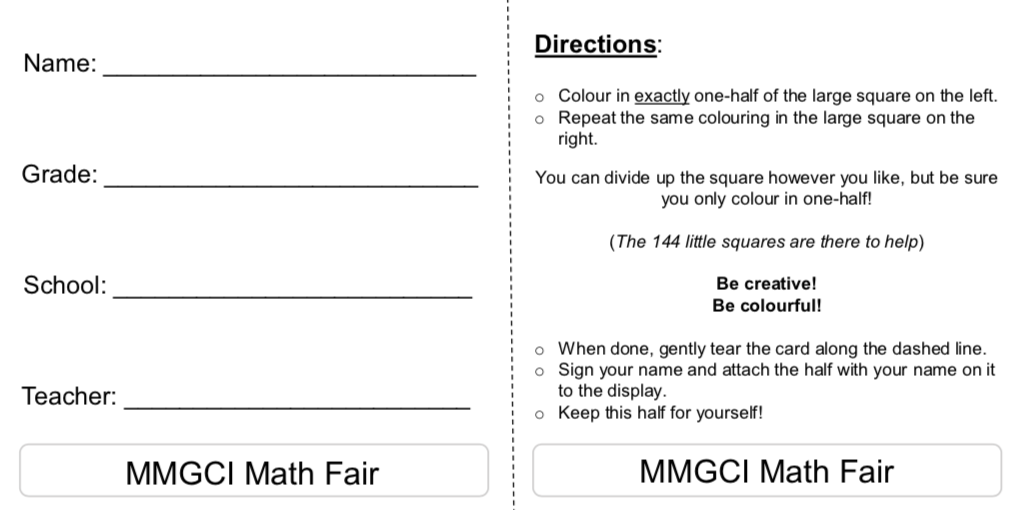
The directions on the back of the One-Half card 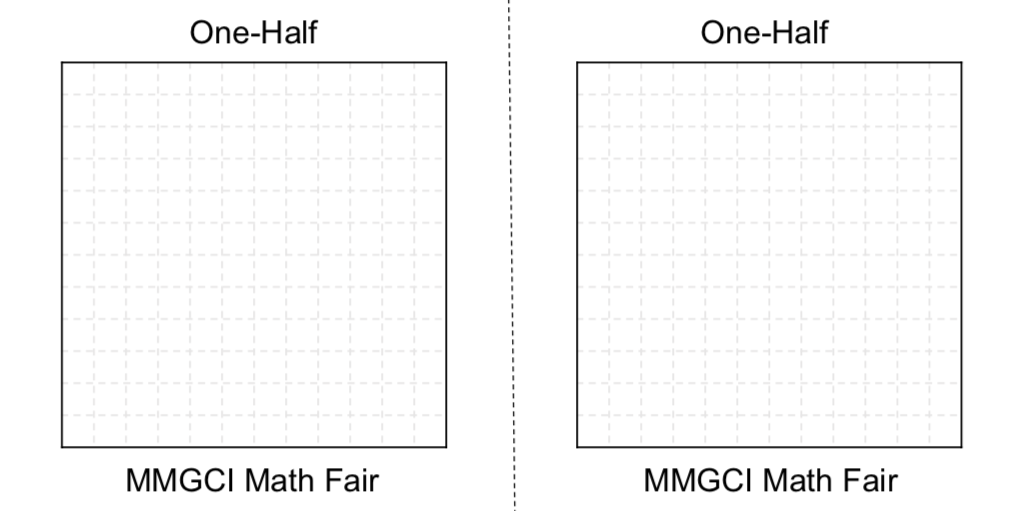
The front of the One-Half card
Cup Stacking Station
The cup stacking station is an exercise in data collection and modelling where students clock how long it takes them to build cup pyramids of specific sizes and use that data to predict their performance on larger and larger pyramids.
Students establish their times for 1-row pyramids through to 5-row pyramids, each time plotting their data with pushpins on the large Cartesian grid provided. The groups are then tasked with predicting their performance on 6-row and 8-row pyramids. The key here is slowing down and justifying predictions based on the trend in the data. The goal is not to be fast; the goal is to be predictable.
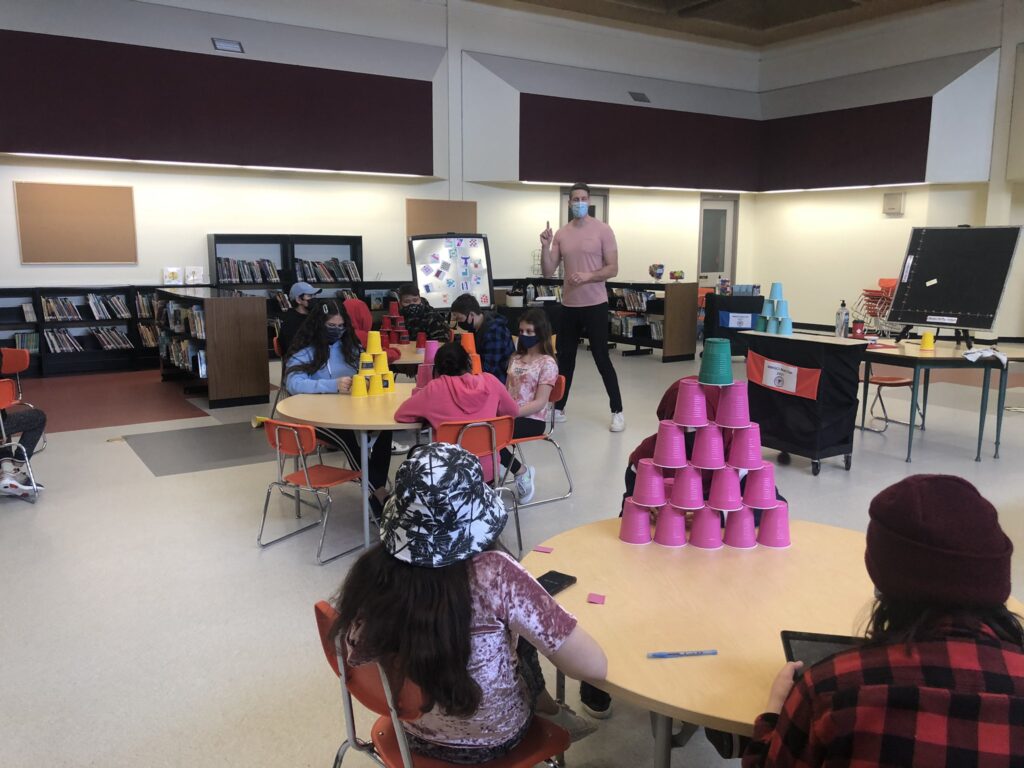
Their teacher guides a group of elementary students through Cup Stacking 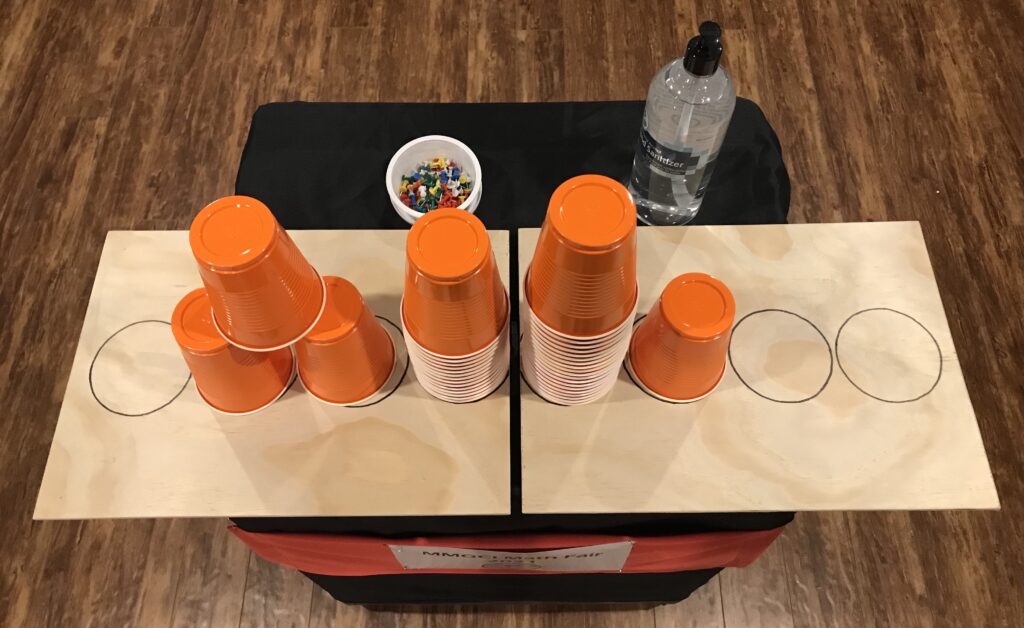
The custom stacking platform 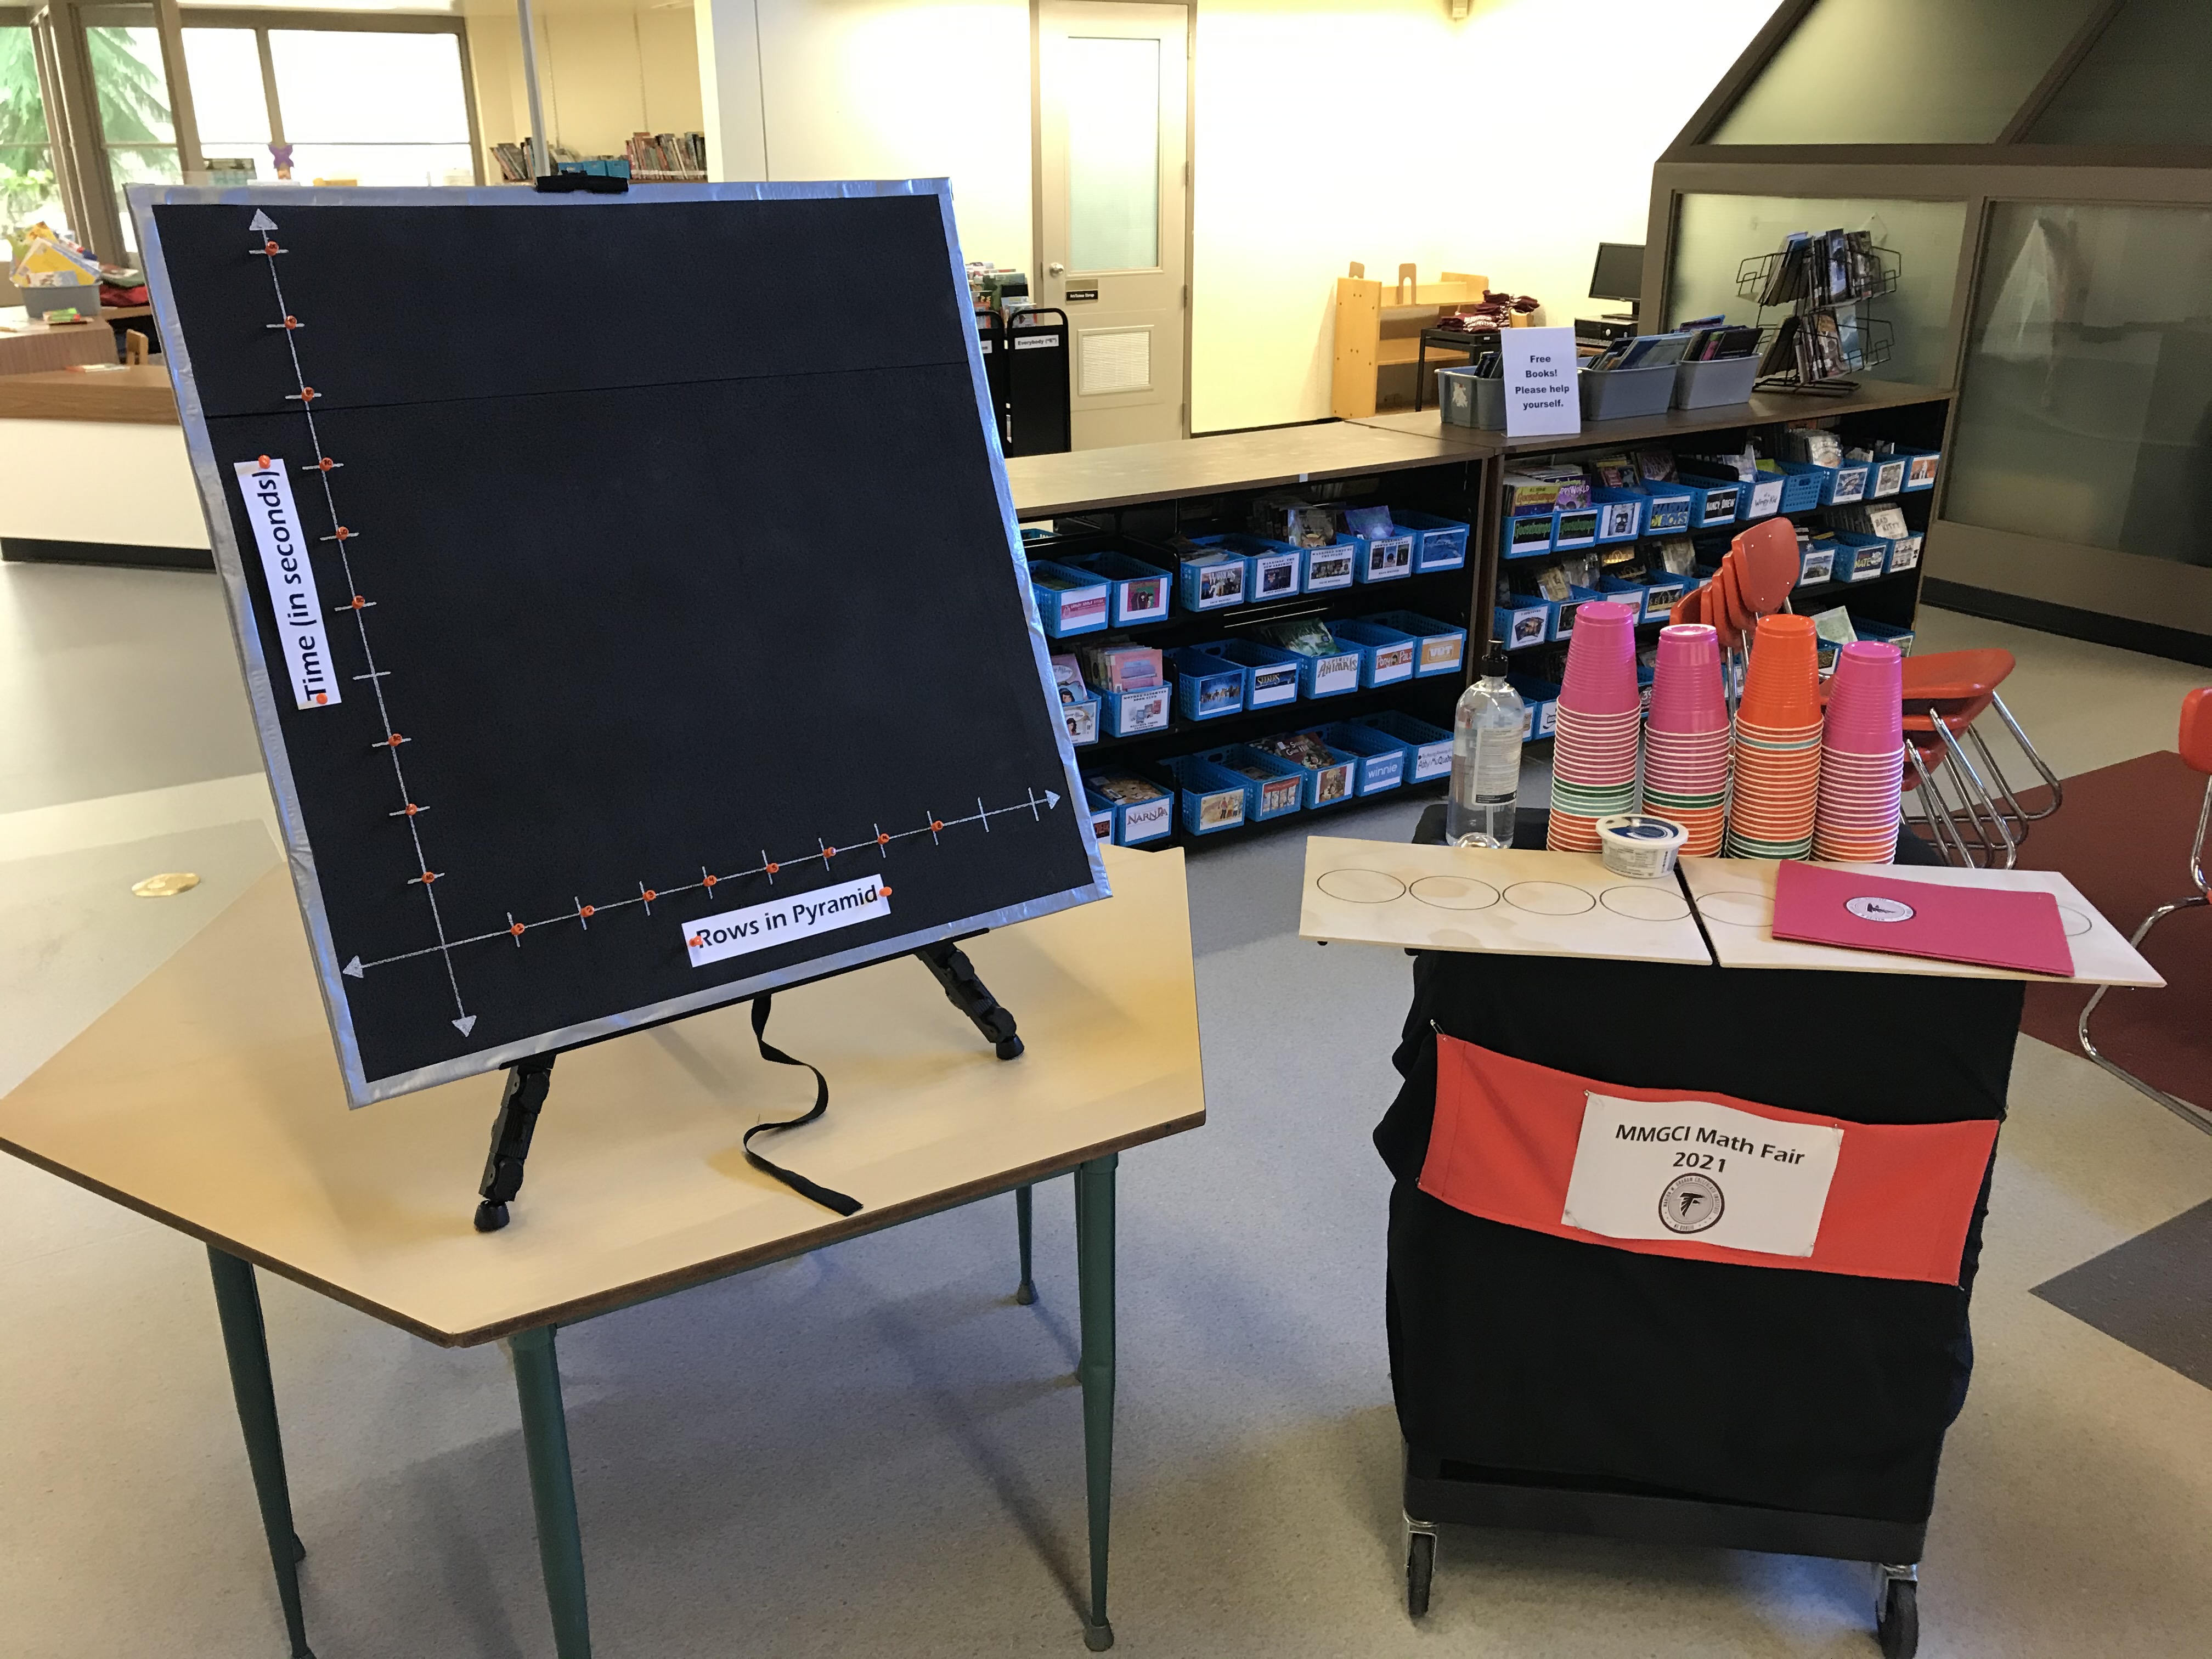
The Cup Stacking Station set up
____________________________________________
In a normal year, I try and visit as many community elementary classrooms as I can, connecting with teachers and meeting my future high school students. Although COVID meant that I needed to keep my distance, the travelling version of the Math Fair was a joy to build and deliver. Let’s do it again next year under better circumstances.
NatBanting