Categories
data analysis estimation fractions play reflection

COVID Math Fair

In 2015, my students and I founded an annual math fair in my school division. Inspired by mathematical play, the fair grew from humble beginnings into a staple of my mathematical calendar. Like nearly everything about this school year, the fair was jeopardized by the pandemic; however, with a touch of innovation and the ongoing support from my school administration, the teams of educators in our five feeder elementary schools, our trustee, and the school community council, I managed to pull together three math invitation carts that could be disassembled, transported, and reassembled in the elementary schools.
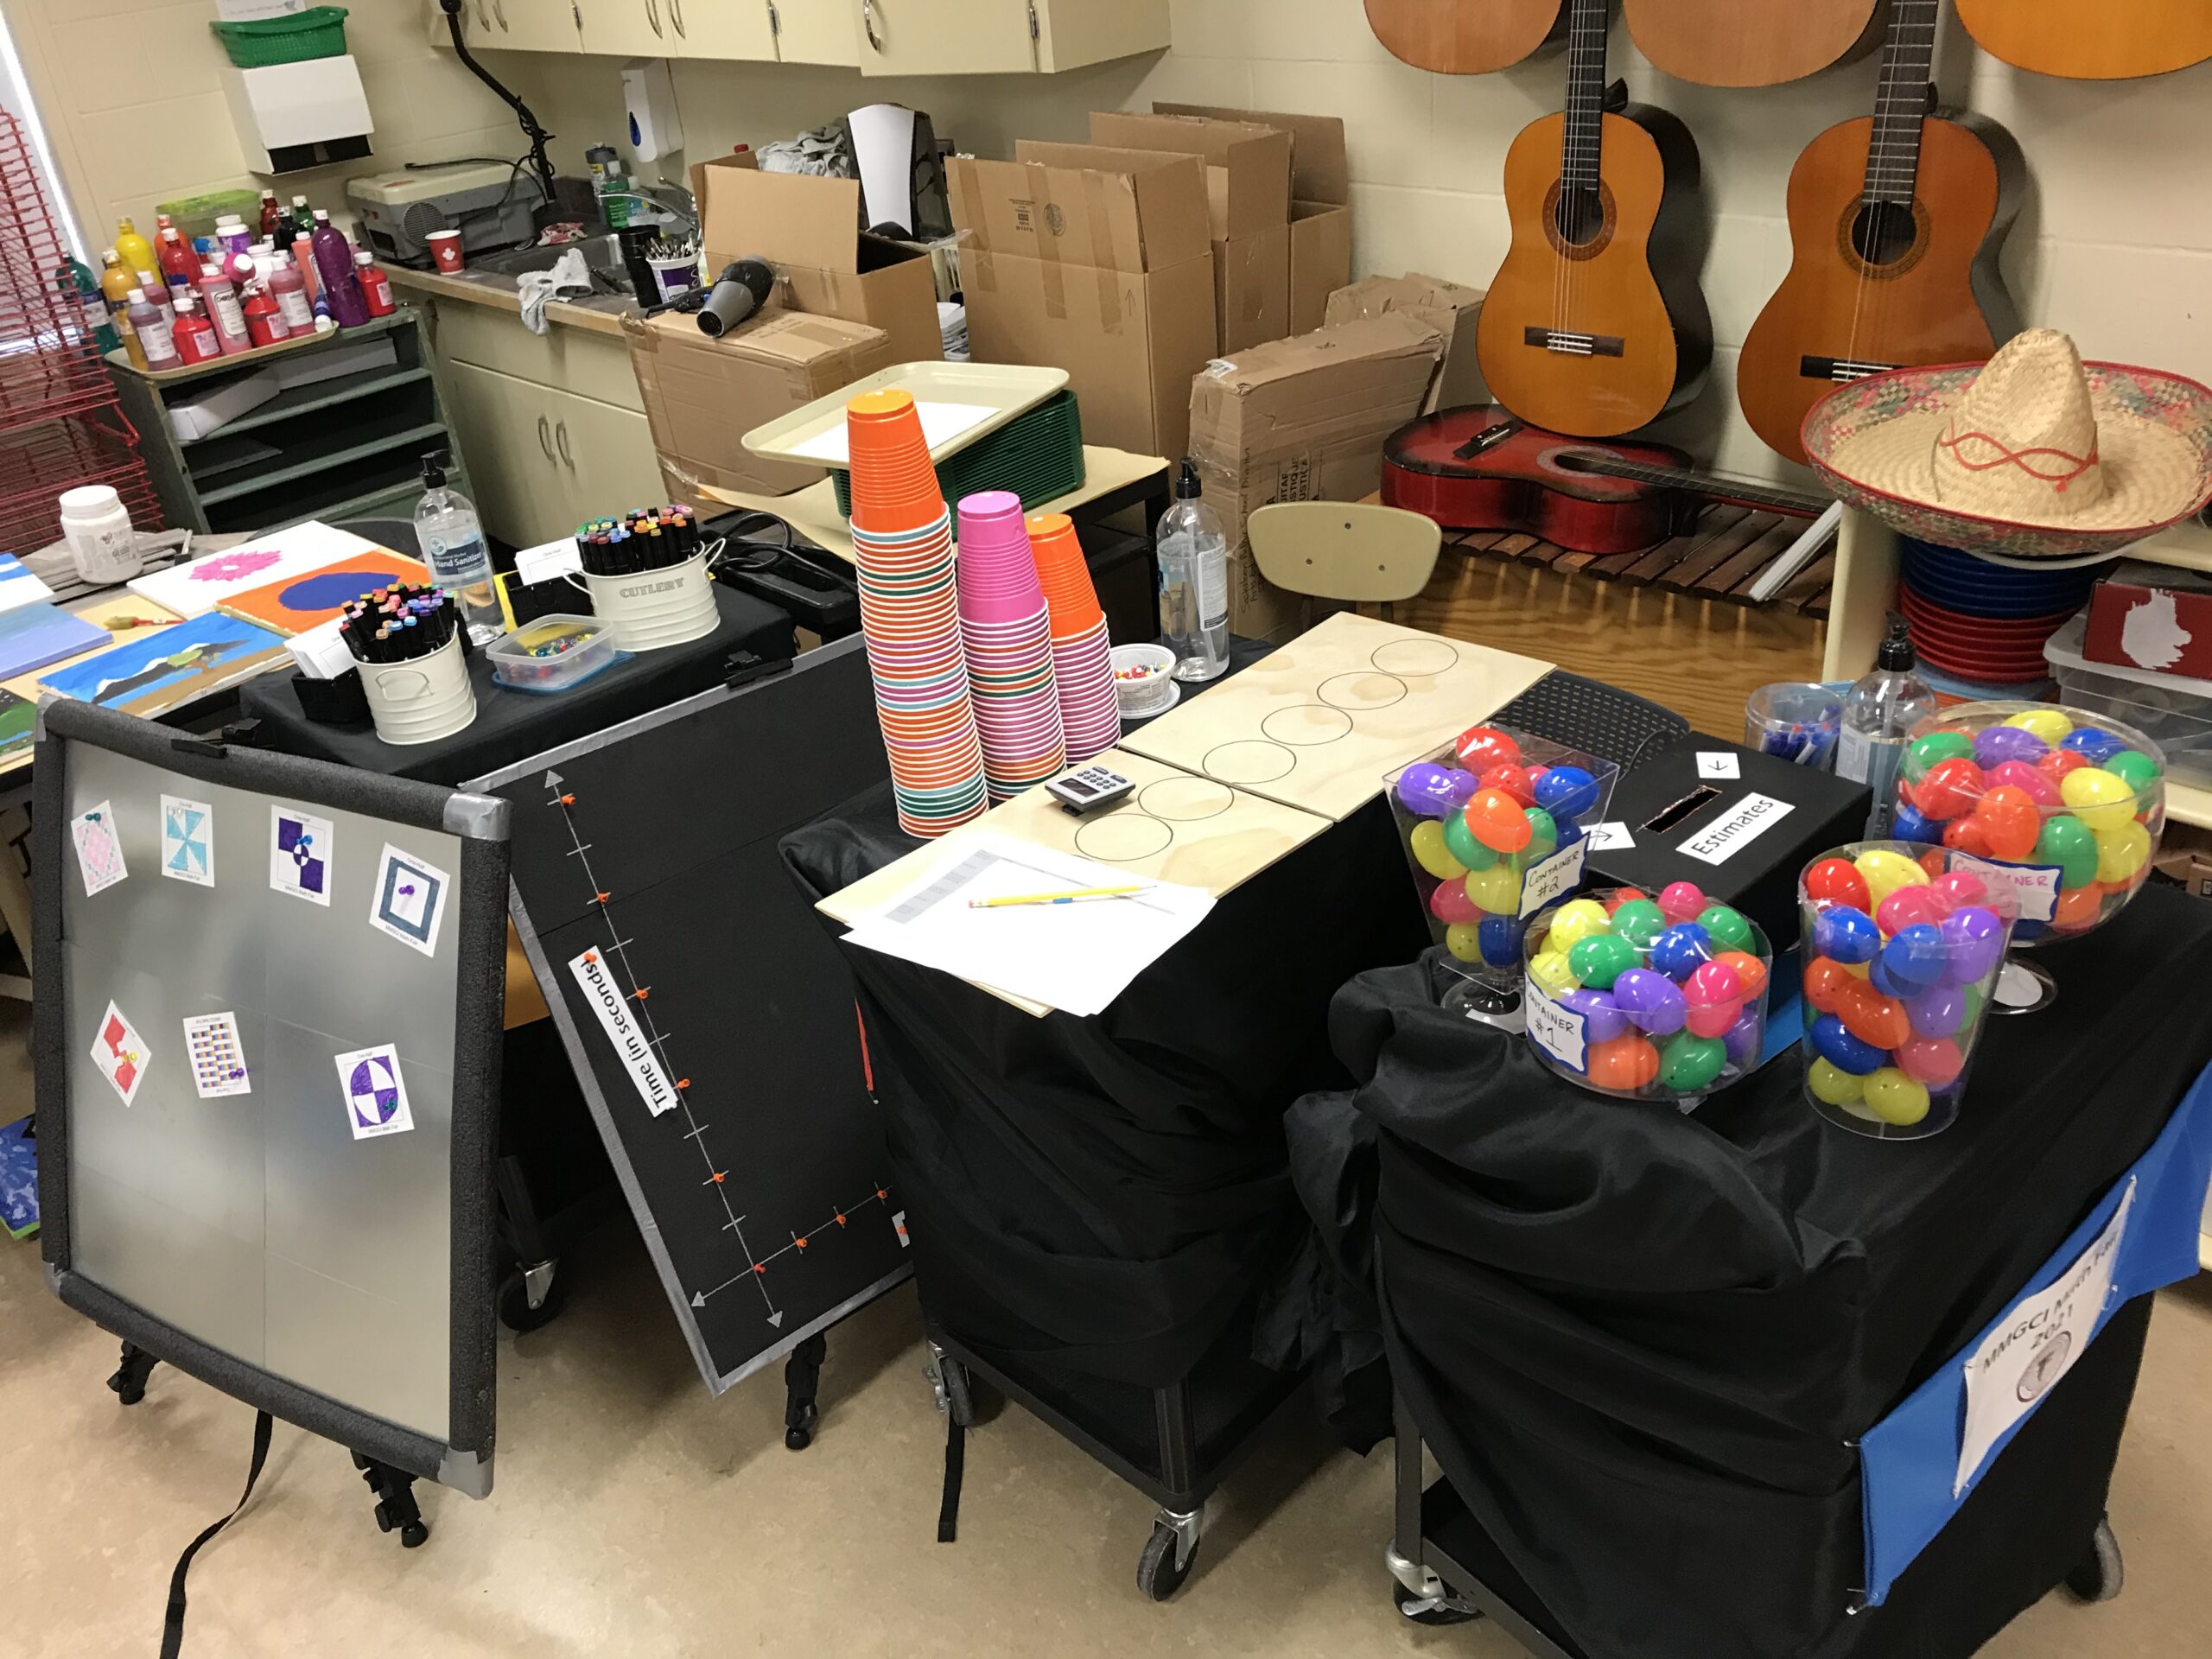
Categories
data analysis discourse statistics

Central Tendency: 10 Burning Questions

My intern just started a unit on statistics with my favourite starter question of all time.

(First blogged near the end of this post in 2011…)

The question is simple: floor is very low, and ceiling is very high.

Create a data set with the following characteristics:
Mean = 3
Mode = 3
Median = 3
Categories
data analysis probability ratios tasks vine

Spinner Data Task

The difference between what should happen and what does happen is a difficult distinction for students. They are so used to finding exact answers in the back of textbooks, that differing experimental results create an sense of uneasiness. At an early age (Grade 9 in my province) we begin to introduce students to the ideas of sampling and experimental probability. 
 
The topic is usually approached with a project or survey of schoolmates. The results are then tallied and then used to create “probabilities” of various things such as favourite sports team, food, or colour. I love the philosophy behind the project approach; student initiative and autonomy is a powerful thing. I, however, don’t like that the experiment involves humans. Here’s why…