My goal this semester was to continue to improve my use of formative assessment (largely through the use of whiteboarding) and expand the role of Project-Based Learning in my classroom. Up to this point, I have developed a wide-scale PBL framework for an applied stream of math we have in the province called Workplace and Apprenticeship Math. Those specific topics lend themselves very well to the methodology; they are a natural fit for PBL. I am still looking for ways to branch the intangibles from PBL into a more abstract strand of mathematics–one that includes relations, exponents, functions, trig, etc.
I decided to build a small project for the end of each unit of study in my Grade 9 class. I chose this goal because:
- I currently have a half semester of Grade 9s, so I’m only responsible for four topics.
- The classes will switch at the midway point. This gives me opportunity to make little adjustments to improve the projects quicker.
In the midst this goal, I have been asked to sit on an informal committee to review how technology can be embraced in our building. I am no technology expert, but am always willing to try something with upside.
History lesson over–let’s move onto the task.
My students will complete this mini-project at the end of the unit on Linear Relations. They are not given any time in class to complete the project, but half a day is devoted to me introducing the students to the necessary technology. (YouTube, Paint, and LinoIt.com).
Students are to use the miracle of self-publishing to find an appropriate video on YouTube. The video must be longer than ten seconds but shorter than thirty. They will then choose variables, create a constant scale, and graph the relation portrayed on the screen. My guess is the grading will involve plenty of sports bloopers and “Fail” compilations.
I initially was going to get the students just to write out the video’s URL and hand in a hard copy of the graph, but then decided that the entire class would benefit from seeing the relations. I needed a place where the graph and video could be fully functional in one place. I decided to use LinoIt.com.
LinoIt is an excellent place for online collaboration. I have used it as a simple class website in the past. Parents could access the URL and see homework assignments, student work, links to school sites, and class announcements. The boards can be private or public. My suggestion is to make the board public (anyone can post) but not to broadcast the URL. That way, students do not need to make an account. This speeds up the posting process.
The students download a standard blank graph (directly from the LinoIt board) and are asked to graph their relation accurately. When they are done, they can easily post the video, the graph, and their name to the board. All the instructions are given to them in a handout. The handout as well as graph template can be downloaded here.
When completed, each student’s homework will look something like this:
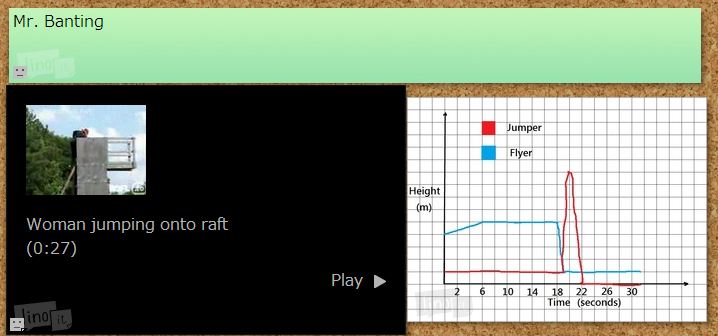
The tools are connective and intuitive. The project is simple and creative. It opens up an opportunity for students to begin to see the world through numerate eyes.
The assessment is three tiered:
- Students assess themselves based on accuracy, challenge, and creativity.
- Students rate peer’s graphs based on the same three criteria. (As we show them to the class).
- I will assess each graph on the previous three plus a completion grade.
My hope is that small, unit-ending projects such as this will begin to include some of the intangible benefits that PBL has brought to my other classes. I want to leave ample opportunity for student choice, autonomy, and innovation. Adding technology only opens those three avenues further.
NatBanting
3 replies on “YouTube Relations”
Bookmarking this project as an idea for some of the teachers in the project I'm working on to do at the beginning of the year. Very cool, thank you.
@David
Thanks Dave! My students love it. We just finished another round. It really raises questions about the intricacies of numerate graphing. Vertical lines, horizontal lines, slopes, dashes, scales, etc.
I also find it is very accessible for teachers to see where the personal strategies can have large class value.
Thanks for reading.
I Like It!!